Dashboard Settings
The Dashboard Settings task allows you to adjust the appearance of the charts in the workspace. You can also adjust how the data is displayed.
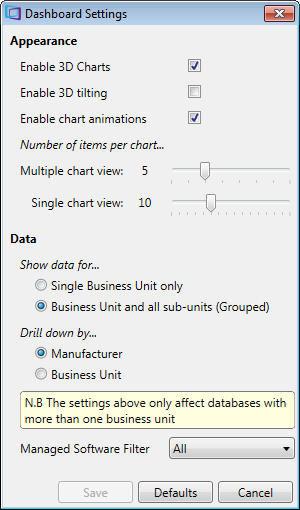
The Appearance settings allow you to adjust how data is displayed in the dashboard.
- The Enable 3D Chart tick-box allows you to set the charts to appear in two or three dimensions.
- The Enable 3D tilting tick-box is only available if the Enable 3D Chart tick-box is ticked. It causes the charts to tilt when the mouse hovers over them.
- The Enable chart animations tick-box animates the charts when drilling into the data.
- The Number of items per chart setting allows you to change the number of columns that appear in the column charts. There can be a minimum of three columns in the Multiple chart view and a maximum of 10. There can be a minimum of three columns in the single chart view and a maximum of 20.
The Data settings allow you to select what data is displayed in the dashboard.
- The Show data for Single Business Unit only setting displays the data for only the selected Business Unit in the charts.
- The Show data for Business Unit and all sub-units (Grouped) setting displays the combined data for the selected Business Unit and its child Business Units in the charts.
- The Drill down by Manufacturer setting sets the top level charts to display by Manufacturer.
- The Drill down by Business Unit setting sets the top level charts to display by Business Unit. This prevents you from combining the data from a parent Business Unit and its child Business Units.
- The Managed Software Filter sets the filter for the data displayed in the dashboard and the default filter for the data displayed in the compliance workspace:
- Select All to view all data
- Select Finalized Only to only display data that is managed in the compliance workspace
- Select In Progress Only to only display data that is unmanaged in the compliance workspace
Click Defaults to return all settings to the default.